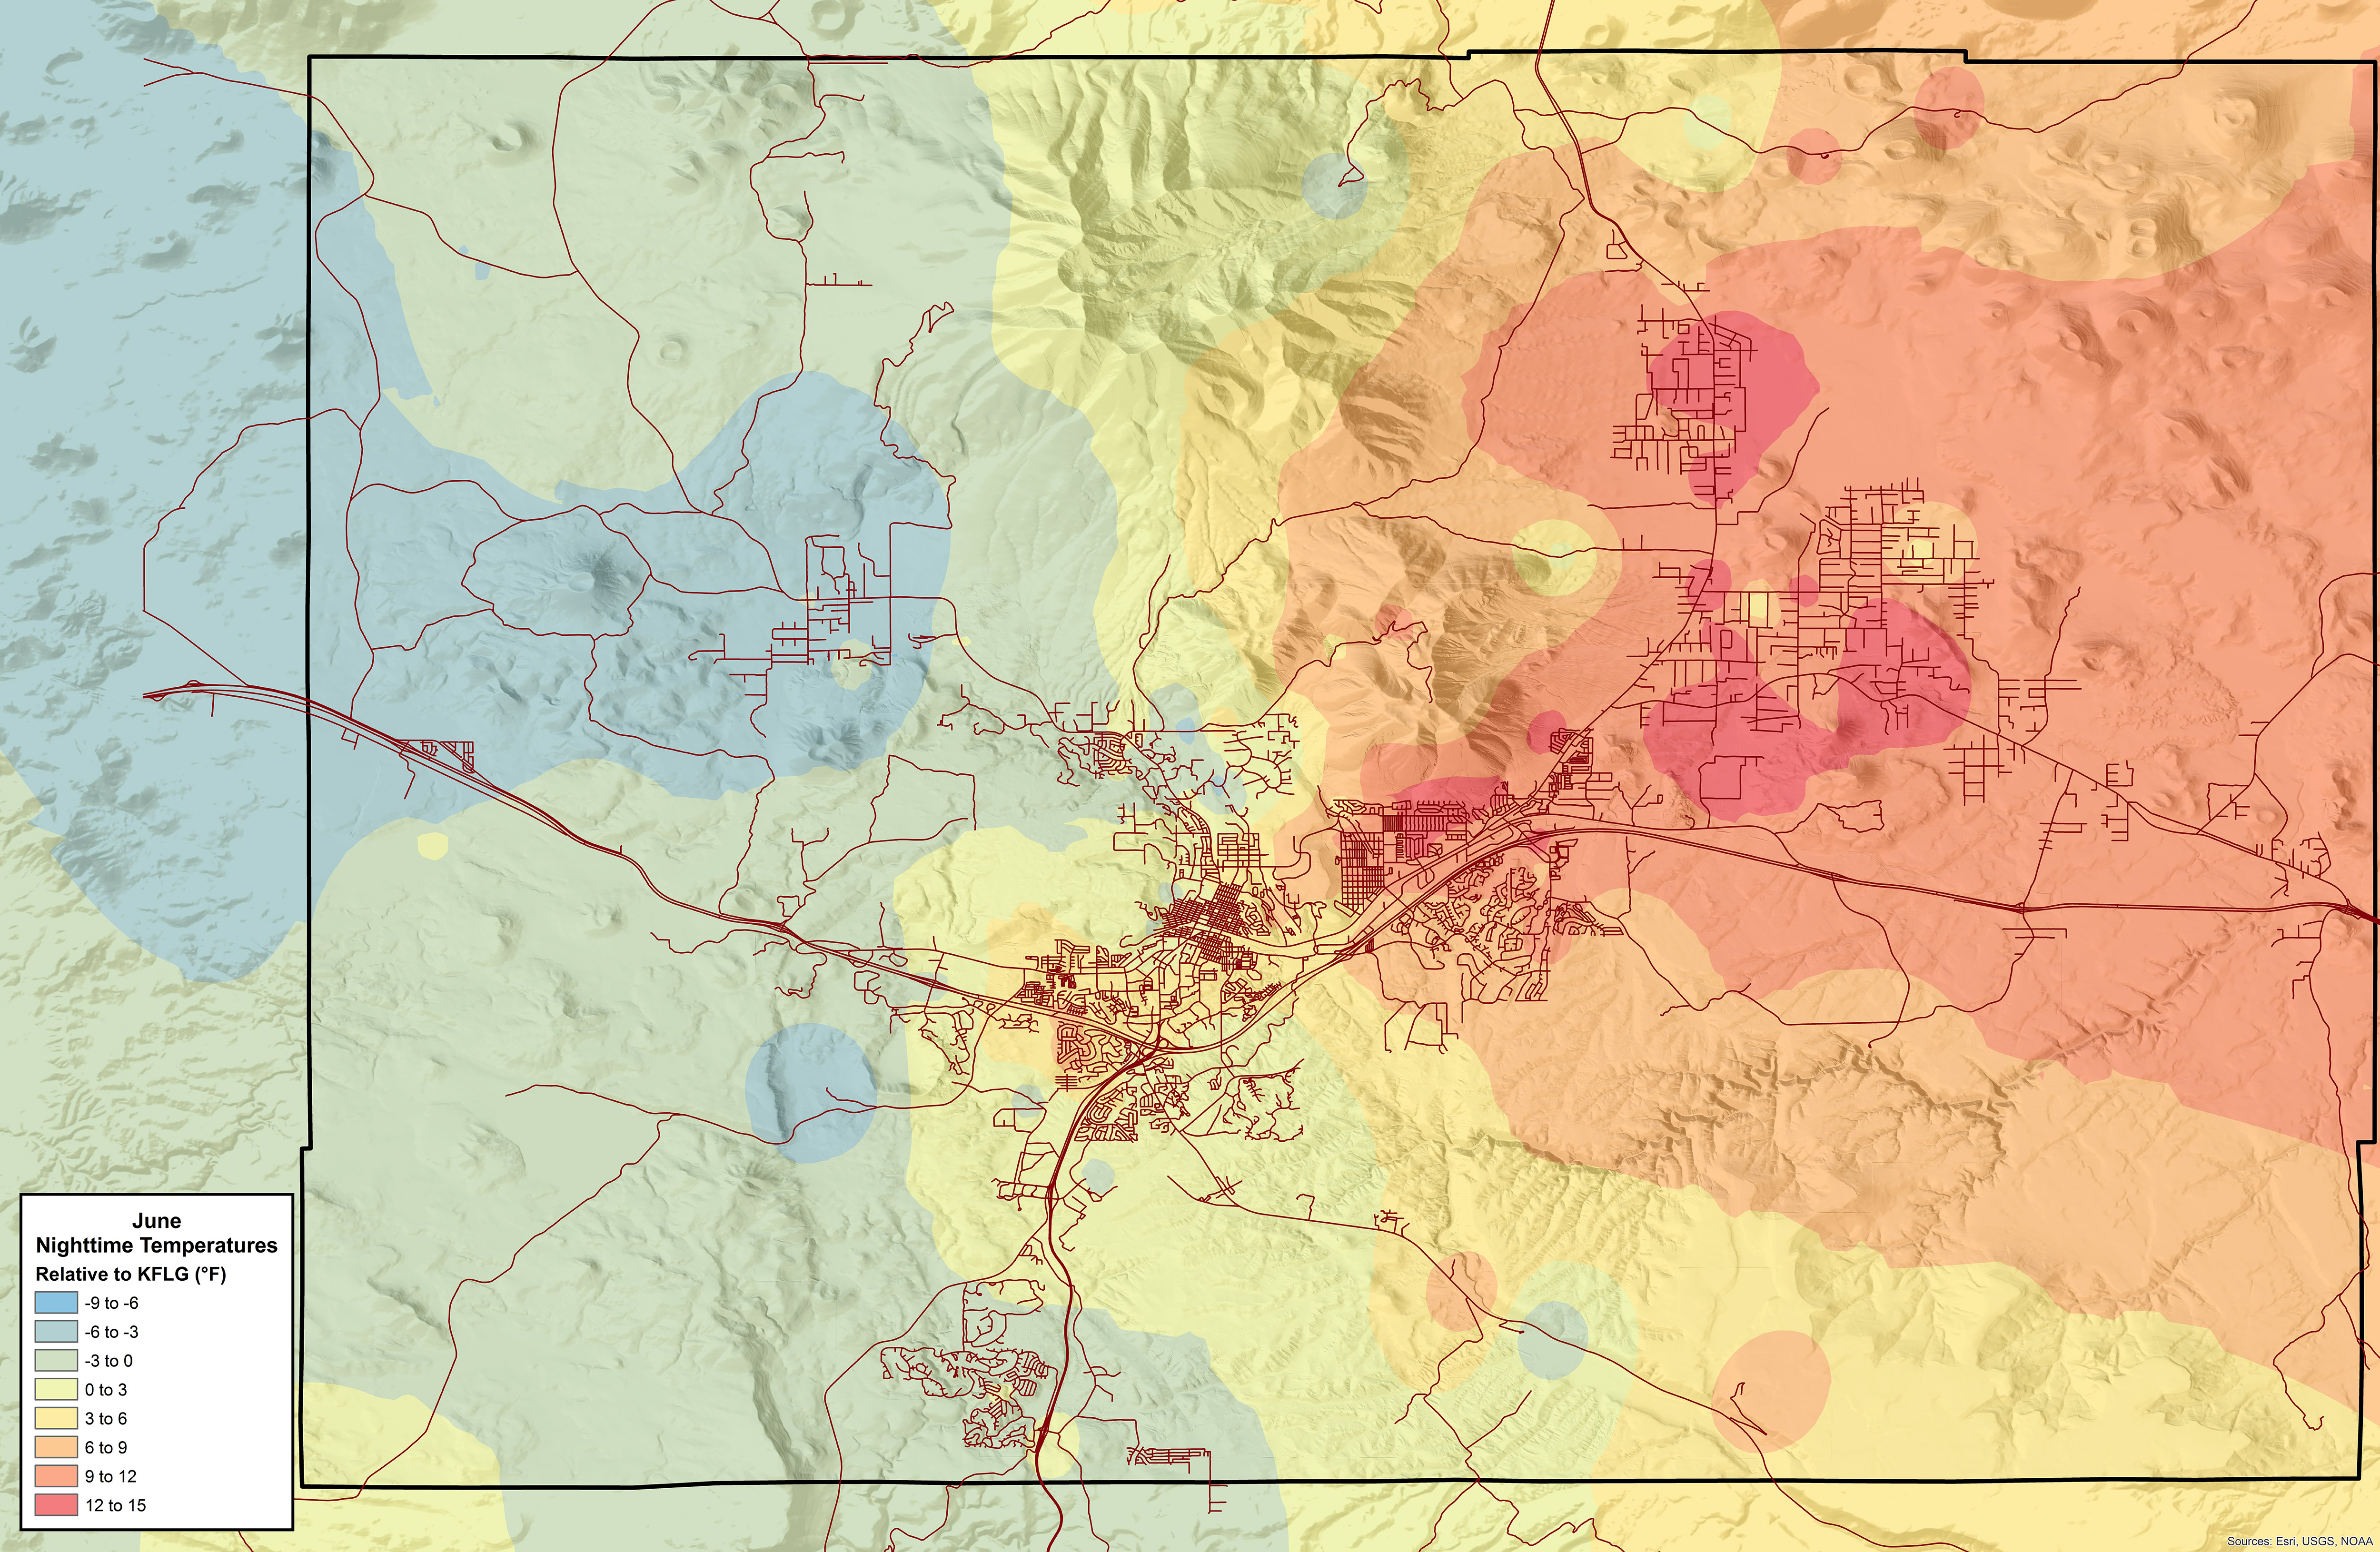
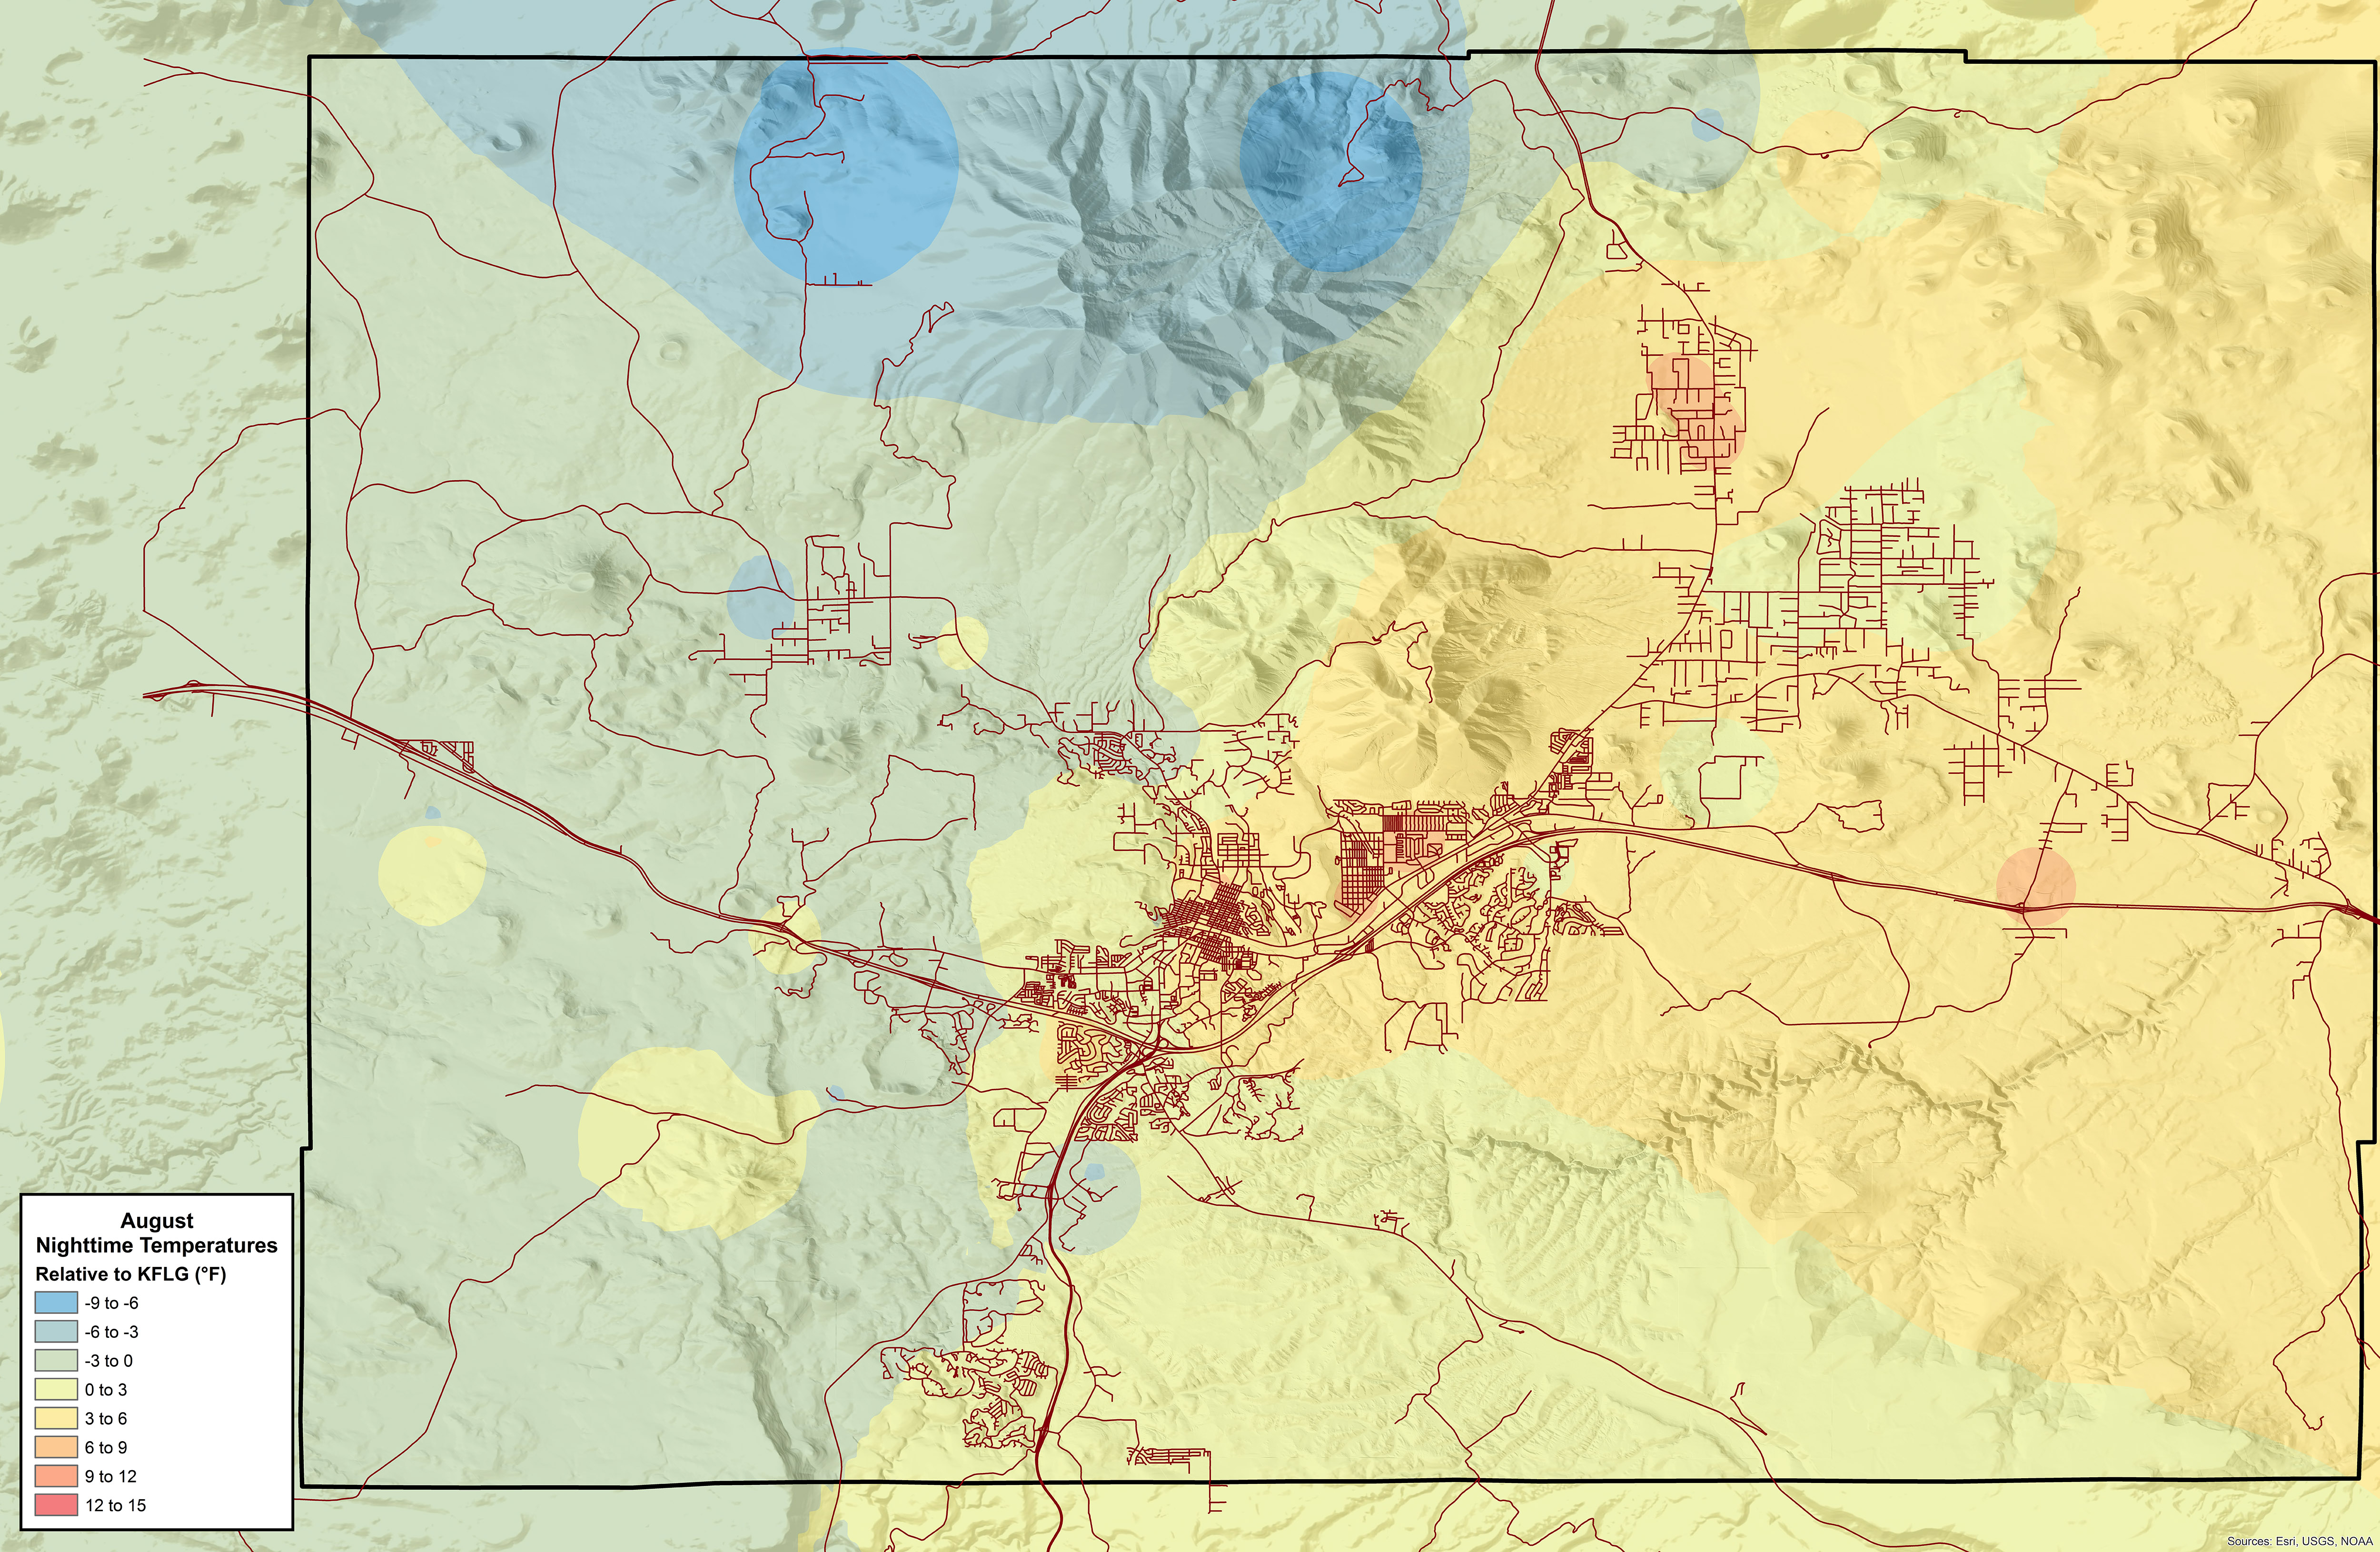
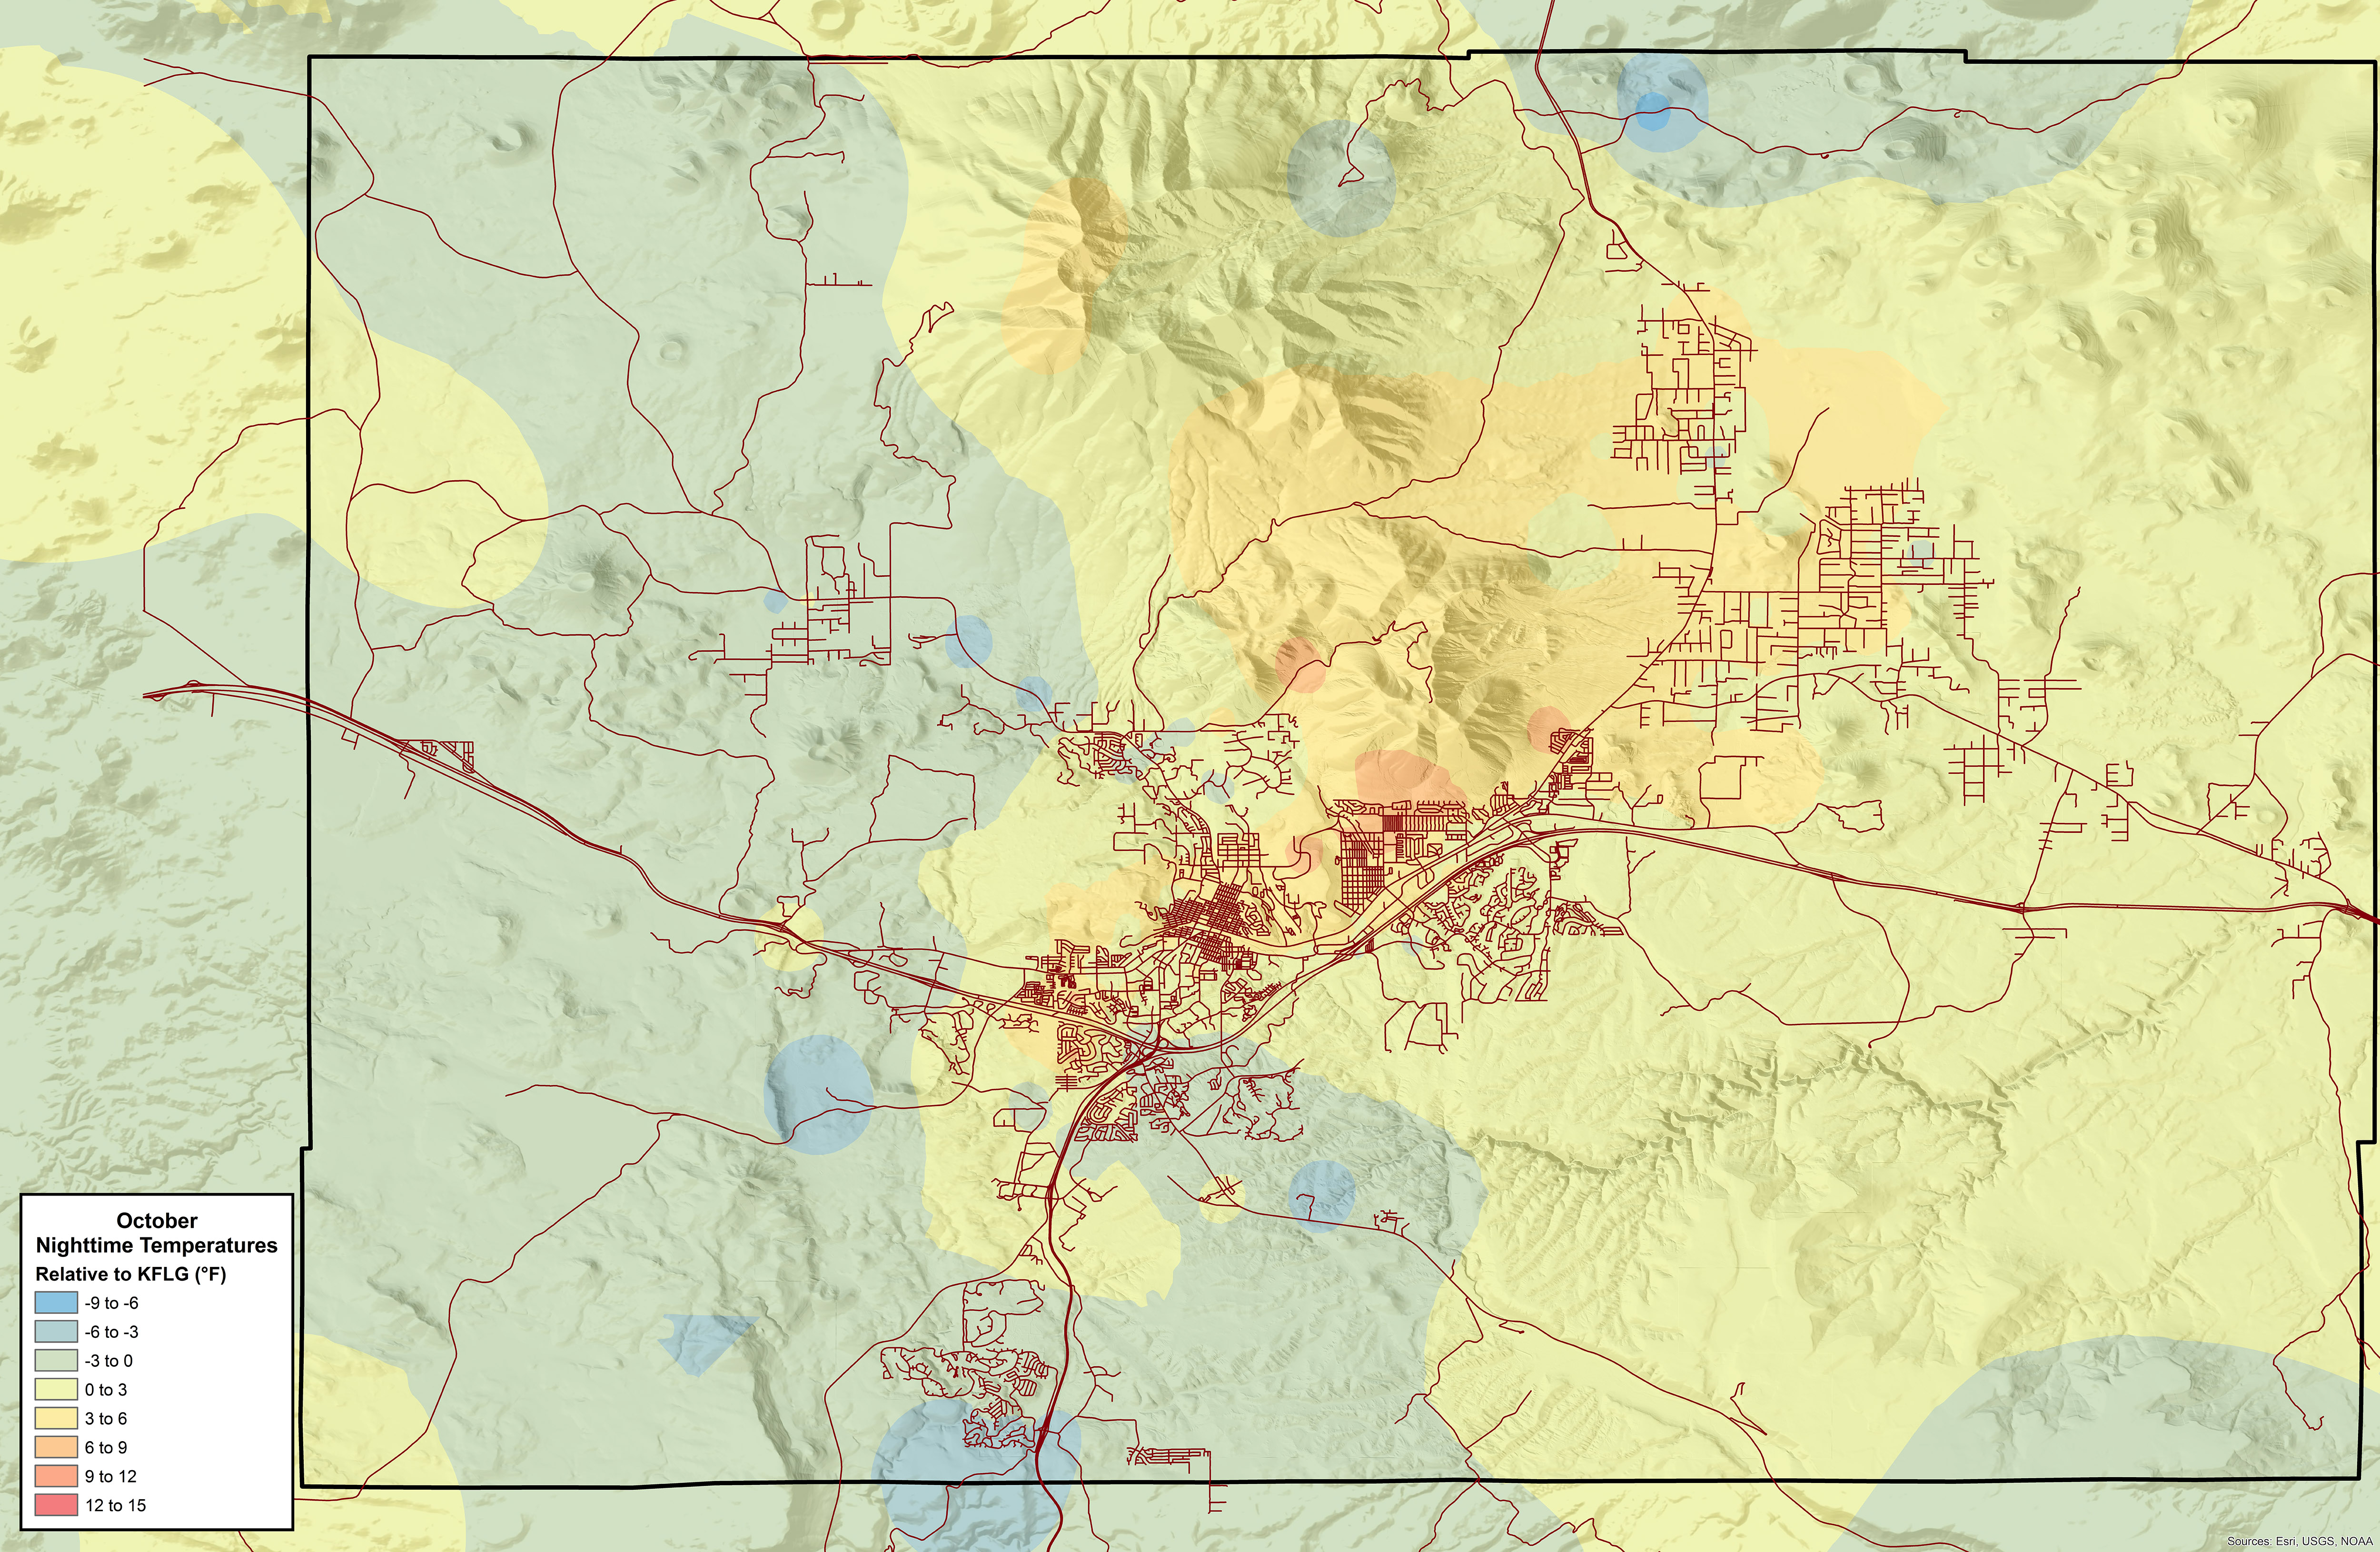
These maps compare overnight low temperatures in different parts of the Flagstaff area to observations at KFLAG (Flagstaff Pulliam Airport). They show average deviations during the growing season based on weather records from 1950 to 2014. They will help you understand your site, but they are not forecast maps. Conditions on any given night—including cloud cover, wind speed, and moisture—may create greater or smaller deviations than shown on these maps. For an example of how wind can affect overnight temperatures, see the Wind Maps page.
Temperature Maps of the Flagstaff Area:
Note: Maps are framed by the boundaries of the Flagstaff Metropolitan Planning Organization. FMPO is the federal designation for cooperative transportation planning by the City of Flagstaff, Coconino County, and the State of Arizona.
For maximum winter low temperatures, see the updated USDA Plant Hardiness Zone Map. Note: The USDA map for plant hardiness places the Flagstaff area in Zone 6a. However, due to Flagstaff’s varying microclimates, your zone may be colder or warmer than that shown on the USDA map.
Because the Flagstaff area’s rugged landscape creates many microclimates, consider using a simple max-min thermometer to verify the relative temperatures at your site with observations from the airport. See the National Weather Service Forecast Office for Flagstaff website or the Arizona Daily Sun for current weather data.
- Cloudy nights are warmer than clear nights. Cloud cover traps heat, resulting in warmer overnight temperatures.
- Windy nights are warmer than calm nights. Wind mixes low levels of the atmosphere to keep temperatures more steady. Areas protected from wind, however, will still radiate heat away at night and receive cold air flowing down from higher elevations. In other words, areas on the lee side of the San Francisco Peaks will be colder than areas on the windy side.
- Cold air is more dense than warm air. It flows downslope at night, pooling at the base of walls, hedges, and other barriers. The uphill wall of a home will likely create a microclimate that is colder than the surrounding area.
- Cold air also pools in basins. This is one reason why low-lying areas are often open rather than forested. Grasses tolerate deep cold better than pines do.
— temperature maps by Dan Stewart.